


 43 / 132

Cross-border
economic
development
43
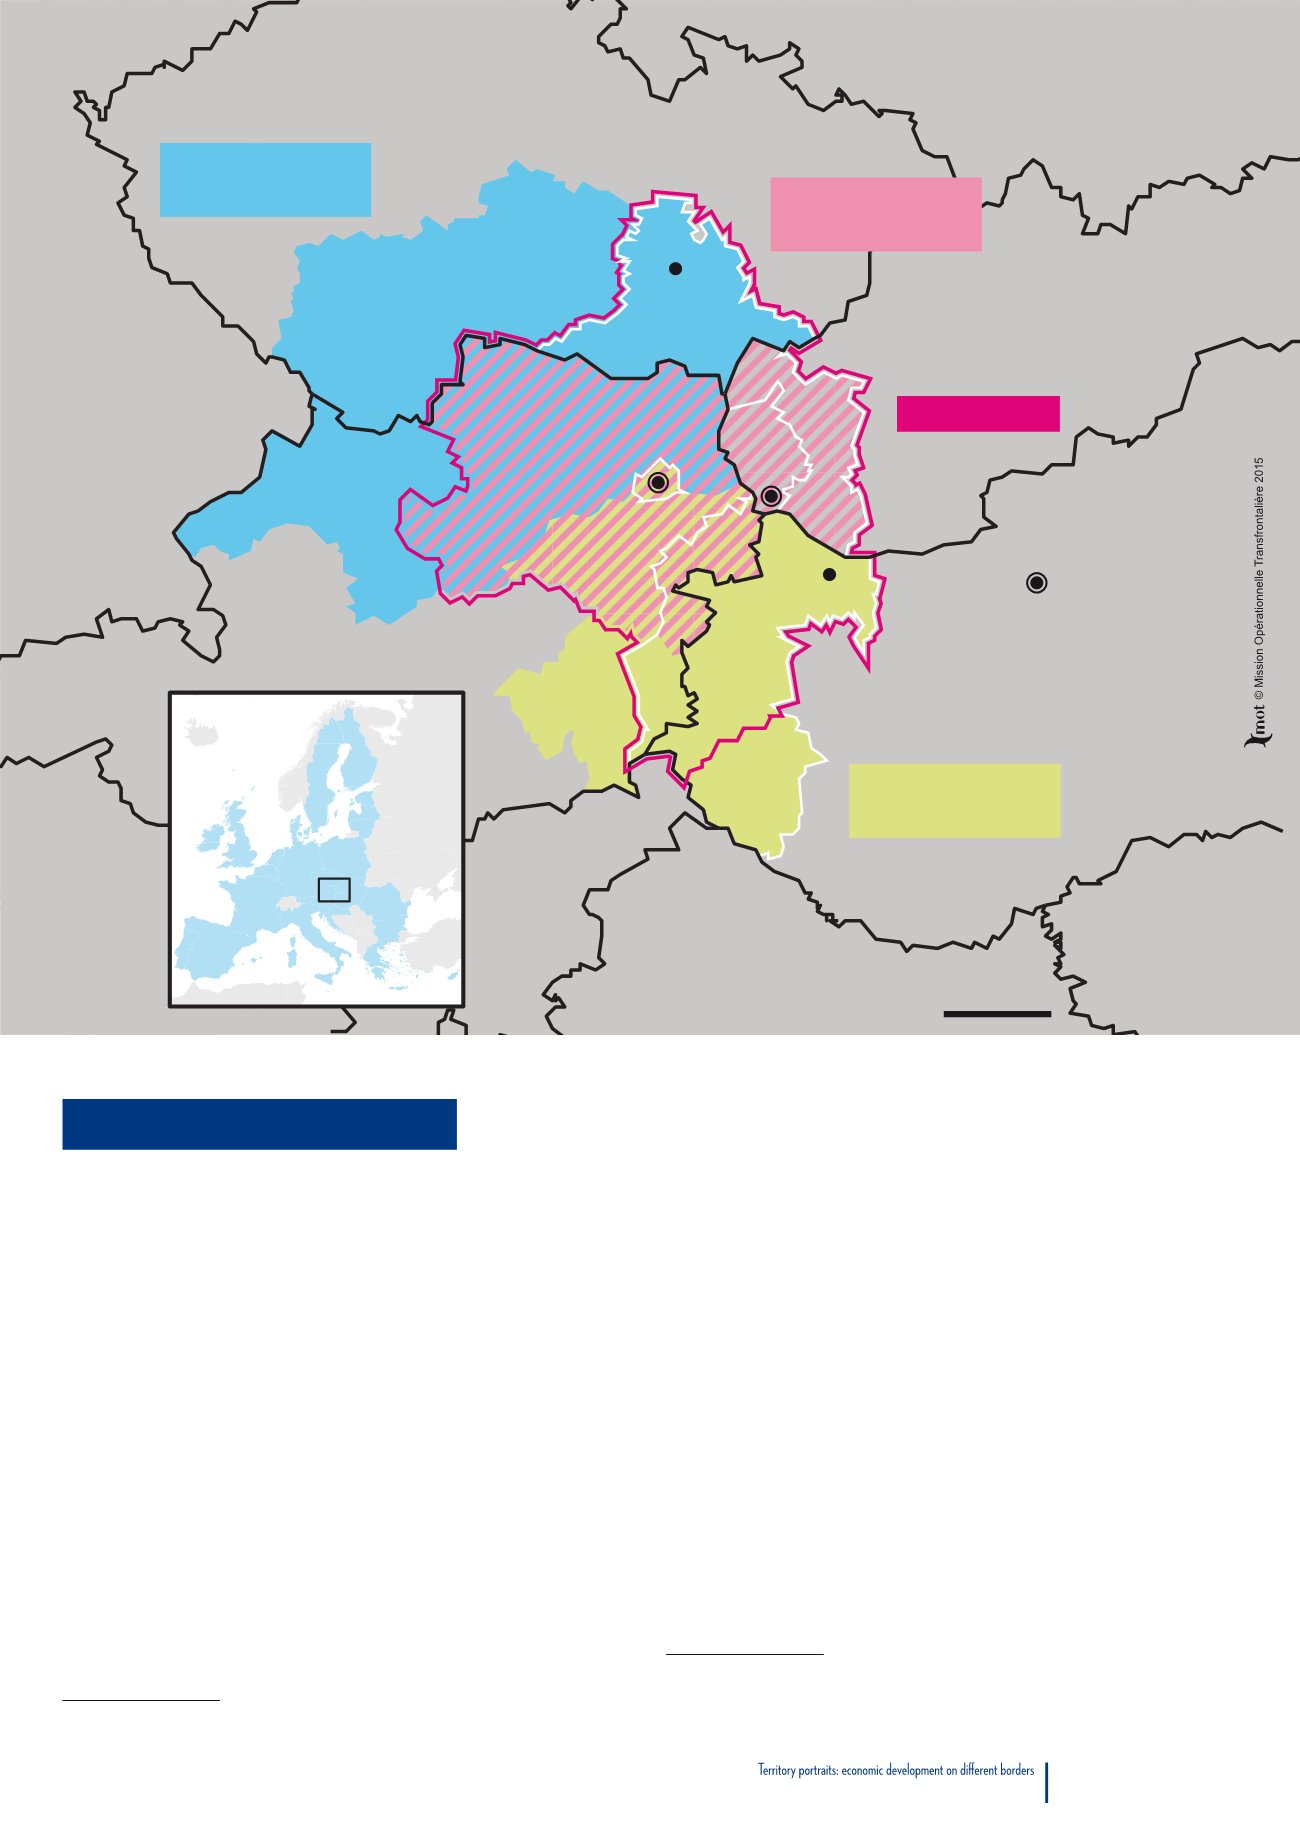
CZECH REPUBL IC
AUSTRIA
SLOVAKIA
HUNGARY
Brno
Györ
Budapest
SOUTH MORAVIA
Bratislava
TRNAVA
GYÖR-MOSON
-SOPRON
LOWER AUSTRIA
BURGEN-
LAND
Vienna
50 km
Centrope Region
INTERREG
Austria-Hungary
INTERREG Autria -
Czech Republic
INTERREG
Austria-Slovakia
Vienna - Bratislava
and neighboring regions
Comparison of framework
conditions
Framework conditions are fairly different between Austria and its
neighbours which joined the European Union in 2004: GDP per capita
in terms of purchasing power standards, with the European average (27
countries) giving the base of 100, stood at 129 for Austria in 2013, 76
for Slovakia and 80 for the Czech Republic.
78
There is a big differential
78
Source: Eurostat. Hungary stands at 67. As a comparison, France is at 108.
in terms of wages, with a ratio of around 1:3 with respect to the average
national wage. Regarding taxation, companies are also taxed less in
Slovakia,
79
which has led Austrian firms to set up subsidiaries in, or
even relocate to, Slovakia (with the same phenomenon occurring from
Slovakia to Hungary). Cross-border work is expanding quite strongly
in the area of support services to individuals, in Austria: the ageing
population has led to an increase in elderly people’s need for care and
the wage differential has encouraged many people (around 60,000
Czechs and Slovaks) to cross the Austrian border to take up these jobs.
79
The corporate income tax rate is 19% in the Czech Republic and Hungary (with a reduced
rate of 10% in Hungary if turnover is not above 500 million forints), 23% in Slovakia and 25%
in Austria. However, Austria has higher payroll taxes, while Slovakia grants tax credits that
encourage business creation with foreign financing.
Portrait of a territory